FREE DEBT PRINTABLES
Debt Payoff Coloring Sheet: 6 Free Printable Charts
Pick a chart, divide your balance by the number of spaces, start coloring. Those three steps are the usual instruction, and they leave out the one thing that would stop the first six months feeling broken.
- 6 Pictures
- Free PDF
- No Signup
- US Letter
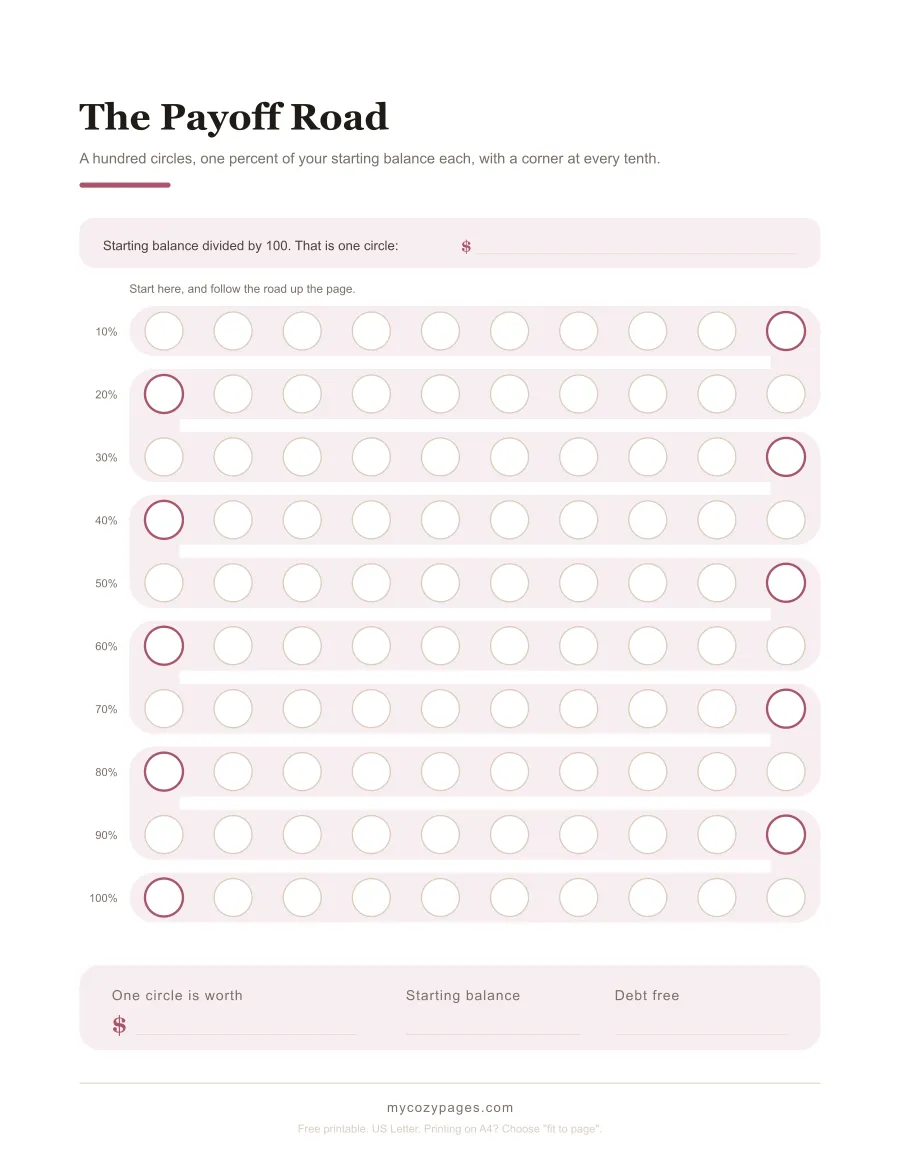
A debt payoff coloring sheet is a picture cut into equal spaces, where one space stands for a slice of what you owe. You color a space in each time the balance falls by that much. The sheets are easy. The arithmetic behind them is where people quietly give up, so this page does that part first.
Jump to
A spreadsheet can do arithmetic that paper can’t. Paper can sit on a refrigerator door, and a spreadsheet never will, and that’s the entire reason this kind of sheet exists. You see it on the way past with a coffee. Nobody opens anything.
So the picture is the product. What is missing from the picture is a number, and it is not the obvious one.
Work out what one circle is worth before you color anything
Divide your starting balance by the number of spaces. On the road below that is a hundred circles, so a $12,000.00 balance makes each circle $120.00.
Everyone says that much. What almost nobody prints is a line to write the answer on, so the figure gets worked out once on a Sunday and is gone by March. Every sheet here has that line on it.
Your balance won’t be a round number, and it doesn’t need to be. A balance of $8,420.37 divides into a hundred circles of $84.20 and a little. That is fine: color the circle when the balance passes the mark. That’s the quiet advantage of a percentage chart, and it’s worth knowing you have it.
The payoff road
The Payoff Road · 100 circles · 1% each · a corner at every tenth
A debt payoff thermometer printable, and why ten rungs isn’t enough
The thermometer is the shape most people picture, and almost every free one has ten segments.
Think about what that means on a debt that takes three years. Ten segments across thirty six months is something to color roughly four times a year, and the whole reason you printed a picture was to have something to do with a pen. A chart you touch once a quarter is a poster.
So the one here has twenty rungs of 5%, which fits any balance, because 5% of anything is still 5%.
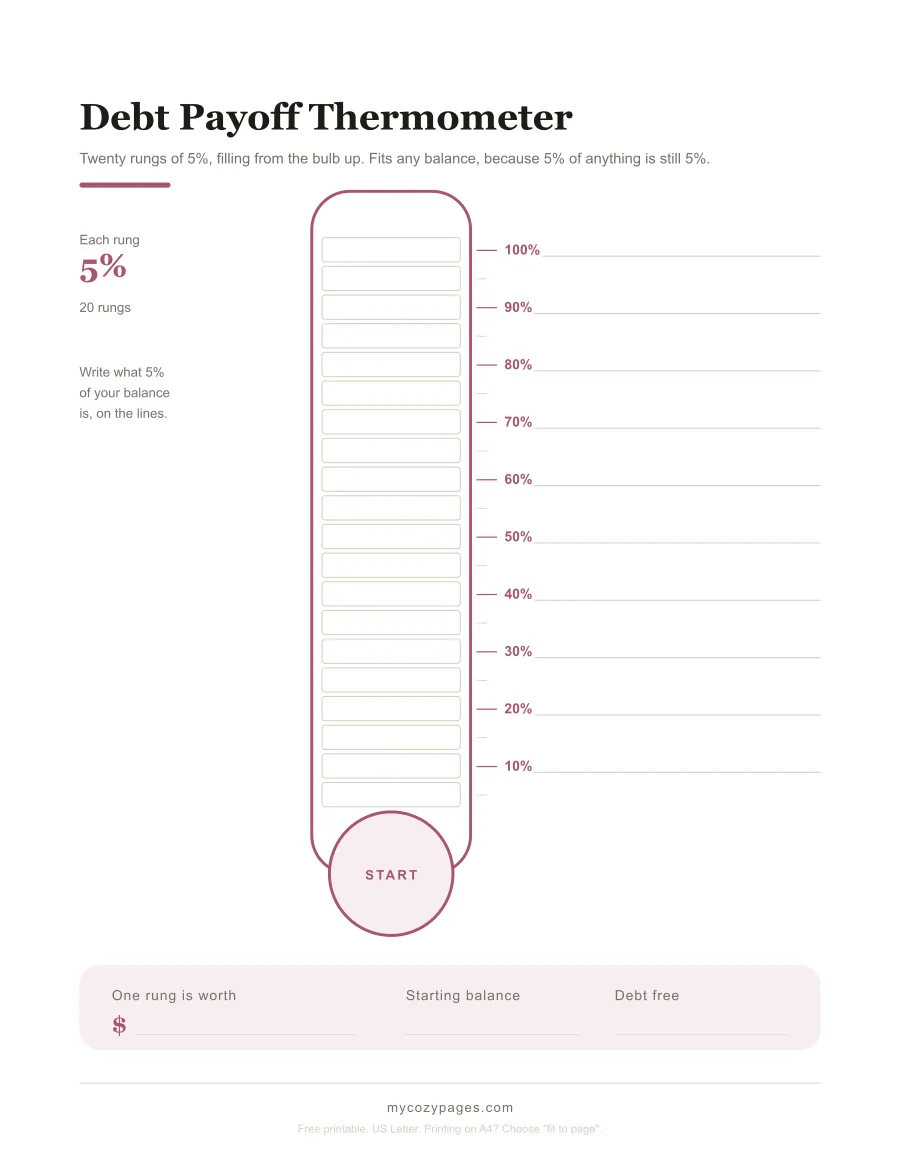
Debt Payoff Thermometer · 20 rungs · 5% each · a line to write your own dollars on
Download the thermometer (PDF)
There is a second one marked in dollars instead, at $500.00 a rung up to $15,000.00. Keep reading for why that one exists, because it isn’t just a different look.
Download the dollar thermometer (PDF)
You pay for three circles and color in one
Here is the part that catches people, and it catches them in the first month.
Take that $12,000.00 balance at 22.15%, which is the Federal Reserve’s published average rate on card accounts being charged interest. Send $400.00. One circle is $120.00, so the payment is worth three and a third circles.
Month one charges $221.50 in interest. The balance moves $178.50. You get to color 1.49 circles.
Nothing has gone wrong. That’s just what a payment does at that rate, and the gap between what leaves your account and what the picture lets you fill in is the reason the first stretch feels like failure when it isn’t. Say it in money and it’s starker still: in month one you sent $268.91 for every circle you colored, against the $120.00 printed on it.
So the pack has a sheet whose only job is to make that visible rather than annoying. One row a month, two figures off your statement, and ten cells to shade for how much of the payment was interest.
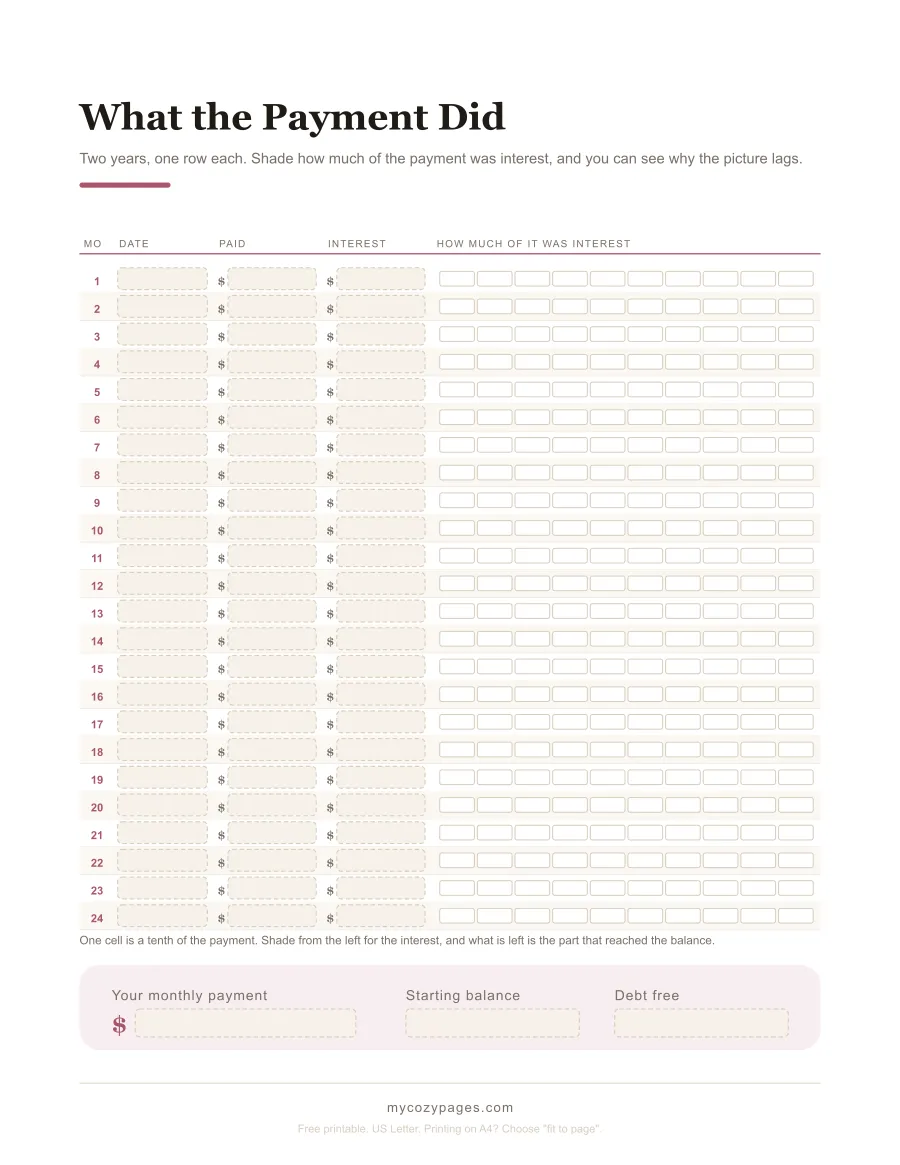
What the Payment Did · 24 months · shade the interest, see what reached the balance
Download the interest sheet (PDF)
The chart speeds up every single row
Follow that same balance all the way down and it clears in 45 months, having paid $17,646.61, of which $5,646.61 is interest.
Now split the hundred circles into ten rows of ten. Each row is the same size on the paper and retires the same $1,200.00 of balance. Here is how many monthly payments each row takes.
| Circles | Finished in month | Payments it took |
|---|---|---|
| 1 to 10 | 7 | 7 |
| 11 to 20 | 13 | 6 |
| 21 to 30 | 18 | 5 |
| 31 to 40 | 23 | 5 |
| 41 to 50 | 27 | 4 |
| 51 to 60 | 31 | 4 |
| 61 to 70 | 35 | 4 |
| 71 to 80 | 38 | 3 |
| 81 to 90 | 42 | 4 |
| 91 to 100 | 45 | 3 |
The bottom row takes 7 payments. The top row takes 3. Same ten circles, same $400.00 every month, and the top of your chart arrives at more than twice the speed of the bottom.
The reason isn’t complicated. Interest is charged on what is left, so as the balance falls the interest falls with it and more of each payment reaches the balance. By month 44 the same $400.00 colors 3.27 circles instead of 1.49, and a circle costs $122.47 to fill rather than $268.91.
That gives you something better to do with a slow start than worry about it. Half the chart is the slow half: it takes 27 payments to reach circle 50 and 18 to finish the rest. The picture is behind the calendar for 42 of the 45 months and only draws level in month 43, which means a chart that looks short of where it should be is a chart doing exactly what the arithmetic says.
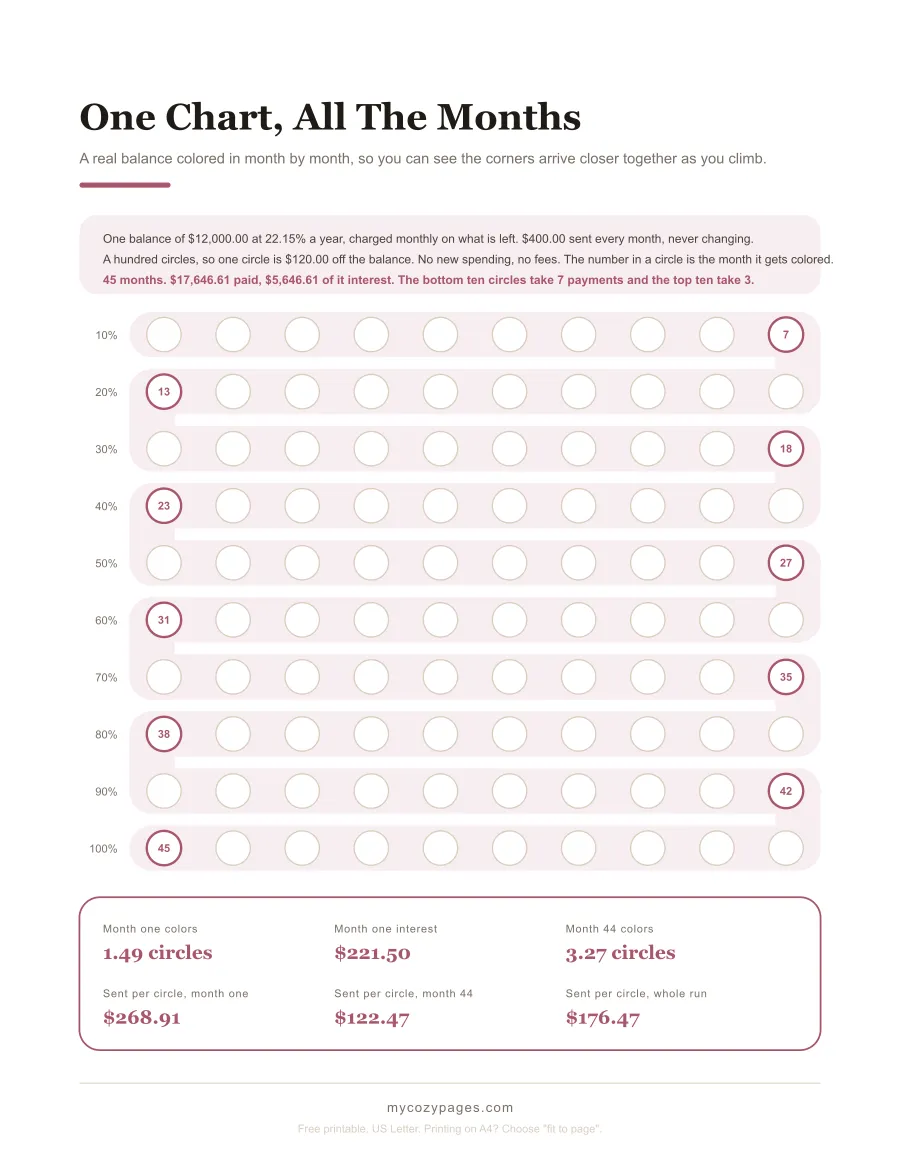
One Chart, All The Months · the corners get closer together as you climb
Download the worked chart (PDF)
Color one of them from the right instead
Almost every picture in this niche fills upward while the number it is tracking goes down. That’s a small strangeness nobody comments on, so there is one sheet here that goes the other way.
Fifty columns, 2% each, colored from the right-hand end inward. Where the color stops is your balance, read straight off the scale underneath. It’s the same information as the thermometer and it feels completely different, and that is worth a printed page to find out about yourself.
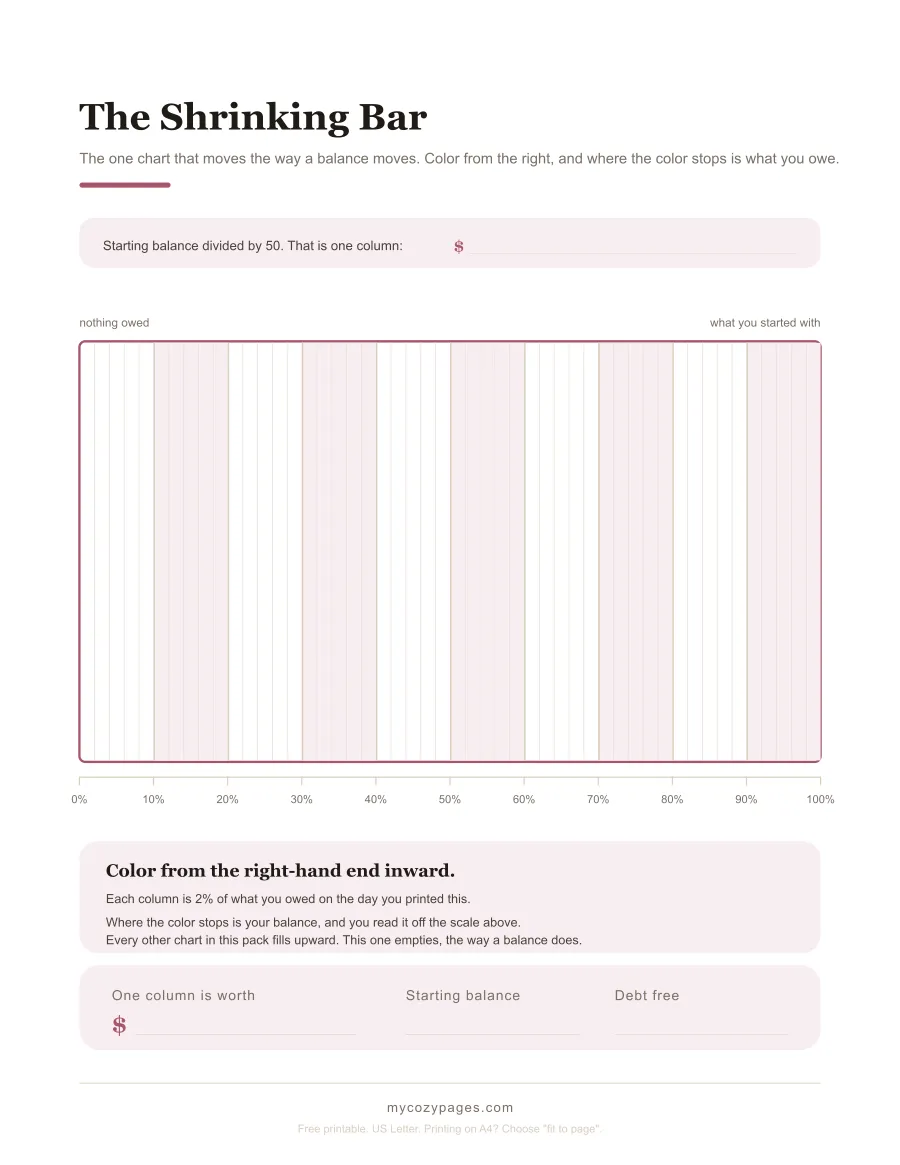
The Shrinking Bar · 50 columns · 2% each · the balance is where the color stops
Download the shrinking bar (PDF)
What happens if you borrow again
A percentage chart is pinned to the balance you had on the day you printed it, and nobody mentions that until it matters.
Take the same run and stop at month 18. You have retired $3,770.34, so 31.42 circles are colored and $8,229.66 is left. Then the car needs something and $2,000.00 goes on a card.
You have now owed $14,000.00 in total and retired $3,770.34 of it, which is 26.93%. Your chart says 31.42%. It’s overstating by four and a half points, and worse, it can no longer finish: a hundred circles of $120.00 only covers $12,000.00, so the paper runs out 16.67 circles short with $2,000.00 still owed. Relabel every circle to $140.00 to fix it and you would have to uncolor 4.49 of the ones you already filled in. Nobody should have to do that to a chart they have been keeping for a year and a half.
A dollar chart doesn’t have this problem at all. You had colored 37 boxes of $100.00 plus $70.34 of the next one, and after the new borrowing you have still colored exactly that. The finish line moves from box 120 to box 140 and nothing you did becomes untrue. That’s the whole case for the dollar thermometer, and it’s why the pack carries both.
Where the 22.15% comes from
Two figures, both read on the source’s own site.
The rate is the Federal Reserve’s G.19 consumer credit release, published September 8, 2026, which put the average rate on credit card accounts assessed interest at 22.15% for the second quarter of 2026. That’s the rate used in every calculation above.
The second one names the thing this page is about. In The Consumer Credit Card Market, its report to Congress published December 30, 2025, the Consumer Financial Protection Bureau counts an account as being in “persistent debt” when charges for interest and fees come to more than half of what was actually paid. In 2024 that was 13% of all general purpose credit card accounts, up from 9.9% two years earlier.
That’s the arithmetic on this page given an official name. For one account in eight, more than half of every payment colors nothing in at all.
The $400.00 payment in the example is an ordinary one rather than a heroic one, for what it’s worth. The same CFPB report found most issuers set the minimum at 1% of the balance with interest and fees added on top, which on month one here would be about $341.50.
What is in the pack
| Sheet | What it does | Pages |
|---|---|---|
| Debt payoff thermometer | 20 rungs of 5%, with a line for your own dollars | 1 |
| Dollar thermometer | 30 rungs of $500.00, for a balance that may move | 1 |
| The payoff road | 100 circles, 1% each, a corner at every tenth | 1 |
| The shrinking bar | 50 columns, colored from the right | 1 |
| What the payment did | 24 months of shading the interest | 1 |
| The worked chart | the example above, month by month | 1 |
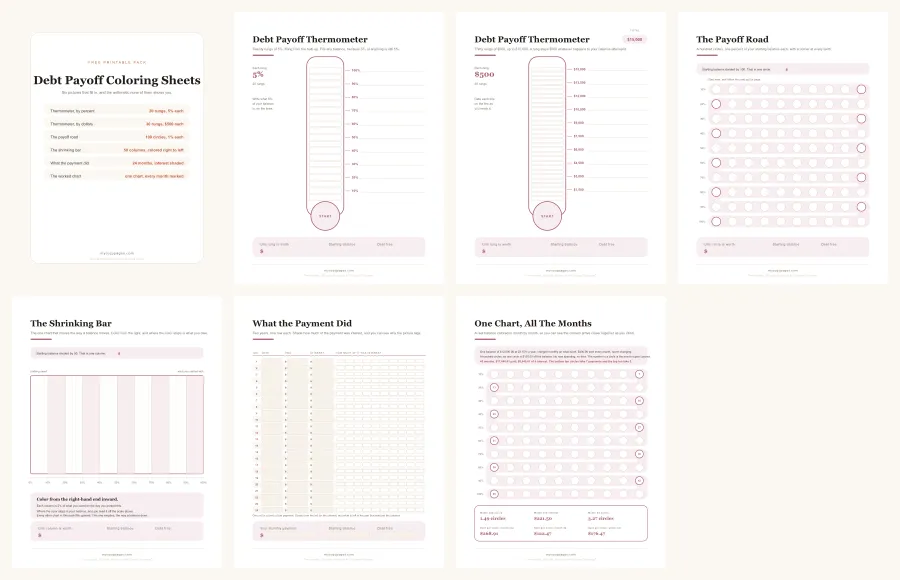
Download all 6 sheets as one PDF
Every sheet is US Letter, 8.5 x 11 inches, and prints on A4 if you choose “fit to page”. They are line drawings, so they barely touch your ink, and there is no watermark on any of them. The figures on the worked chart go through three checks before the file is written: one script asserts it, a second reads it back off the rendered page, and a third recomputes it from scratch without sharing any code with the first two. All three have to agree, so 45 months is what the arithmetic produced rather than a number anybody typed.
If you would rather have a tracker with columns than a picture, the debt payoff tracker printables page has a master list with a rate column and a 100 box progress chart.
A note before you start
These are coloring sheets, not financial advice, and the run worked out above is one constructed example with its balance, rate and payment printed on the page. Yours will be different, so every sheet asks you to write your own figure in before you start rather than printing one for you.
The thing worth taking from it is not the 45 months. It is the shape underneath them: wherever interest is charged on a falling balance, the slowest part of the chart is the part you do first, and a picture that looks short of where it ought to be is doing what the arithmetic says. If you’re still deciding which debt the chart should even be for, the debt payoff tracker printables page prices that choice before you commit a wall to it.
Save it for later
Free debt payoff coloring sheets. Six pictures that fill in instead of a grid you tick off: a 20 rung thermometer at 5 percent, a second one at $500 a rung, a road of 100 circles, a bar you color from the right, a sheet for shading how much of each payment was interest, and one chart worked out month by month. US Letter, no email needed.
Save this pinFrequently asked questions
What is a debt payoff coloring sheet?
A picture divided into equal spaces, where each space stands for a slice of what you owe. You color one in every time the balance drops by that much. It does the one thing an app cannot, which is sit on the refrigerator where you see it forty times a day without opening anything.
How do I work out what one space is worth?
Divide your starting balance by the number of spaces. On the 100 circle road that is your balance divided by 100, so a $12,000.00 balance makes each circle $120.00. Every sheet here has a printed line to write that figure on, which is the step most charts leave in your head.
Do I color what I paid, or what the balance dropped to?
What the balance dropped to, always. Part of every payment is interest, so the two numbers are different. On a $12,000.00 balance at 22.15% a $400.00 payment moves the balance by $178.50 in the first month, which is not quite one and a half circles even though the payment is worth three and a third.
Why does the bottom of the chart feel so slow?
Because it is slow, and the arithmetic says so. Interest is charged on what is left, so the same payment retires more balance every month. On the chart worked out on this page the bottom ten circles take 7 payments and the top ten take 3.
How many spaces should a debt payoff chart have?
Enough that one month of paying moves something visible. Most debt thermometers online have ten segments, which on a multi year payoff gives you something to color about four times a year. The thermometer here has 20 rungs and the road has 100 circles.
What happens if I borrow again part way through?
A percentage chart stops being true, because it is pinned to the balance you had on the day you printed it. The dollar thermometer in this pack is not, which is why both are here. There is a worked example of exactly what goes wrong further down this page.
Is there a debt payoff thermometer printable in this pack?
Two of them. One is marked in percentages, 20 rungs of 5%, which fits any balance at all. The other is marked in dollars at $500 a rung up to $15,000.00, for anyone whose balance is likely to move in ways a percentage chart cannot follow.
Are these debt payoff coloring sheets free?
Yes, all six. No email address, no account, no watermark. Take one sheet or take the whole pack as a single PDF, and print it as often as you like.
This printable is part of our guide to Debt Payoff Tracker Printable: 8 Free Sheets.
Get new printables by email
Join the list and I'll email you when there's a new printable. That's all it is: no sales pitch, and every printable on the site stays free to download without it.
Unsubscribe any time. No spam, ever.
You might also like
Debt Payoff Tracker Printable: 8 Free Sheets
8 free debt payoff tracker printables and a calculator that prices your own payoff order. What paying the smallest debt first really costs, to the cent.
Get the printable
Debt Snowball Free Printable: 6 Sheets for the Whole Run
Half of a debt snowball has no wins in it. 6 free printables for the stretch nobody warns you about, with a whole run worked out to the cent.
Get the printable